- 關(guān)于我們
-
關(guān)于我們ABOUT US

- 產(chǎn)品與研發(fā)
-
產(chǎn)品與研發(fā)PRODUCT R&D

- 新聞動(dòng)態(tài)
-
新聞動(dòng)態(tài)NEWS

- 用戶中心
-
用戶中心USER CENTER


Product Information
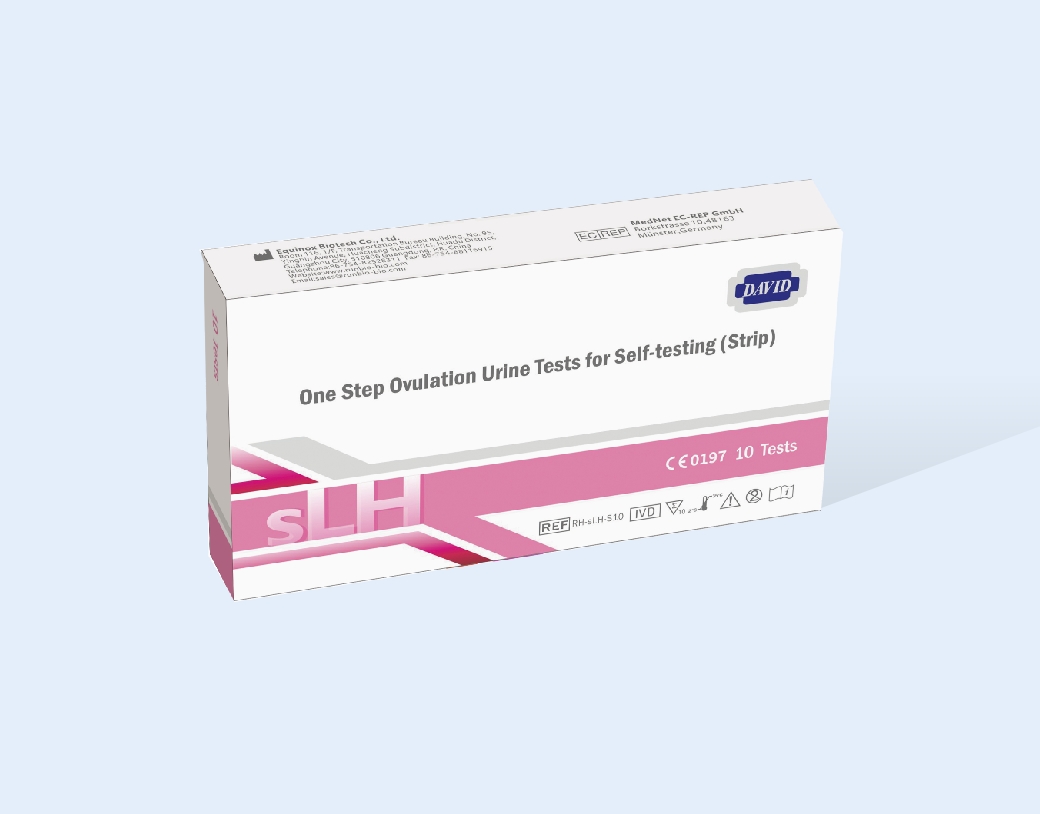
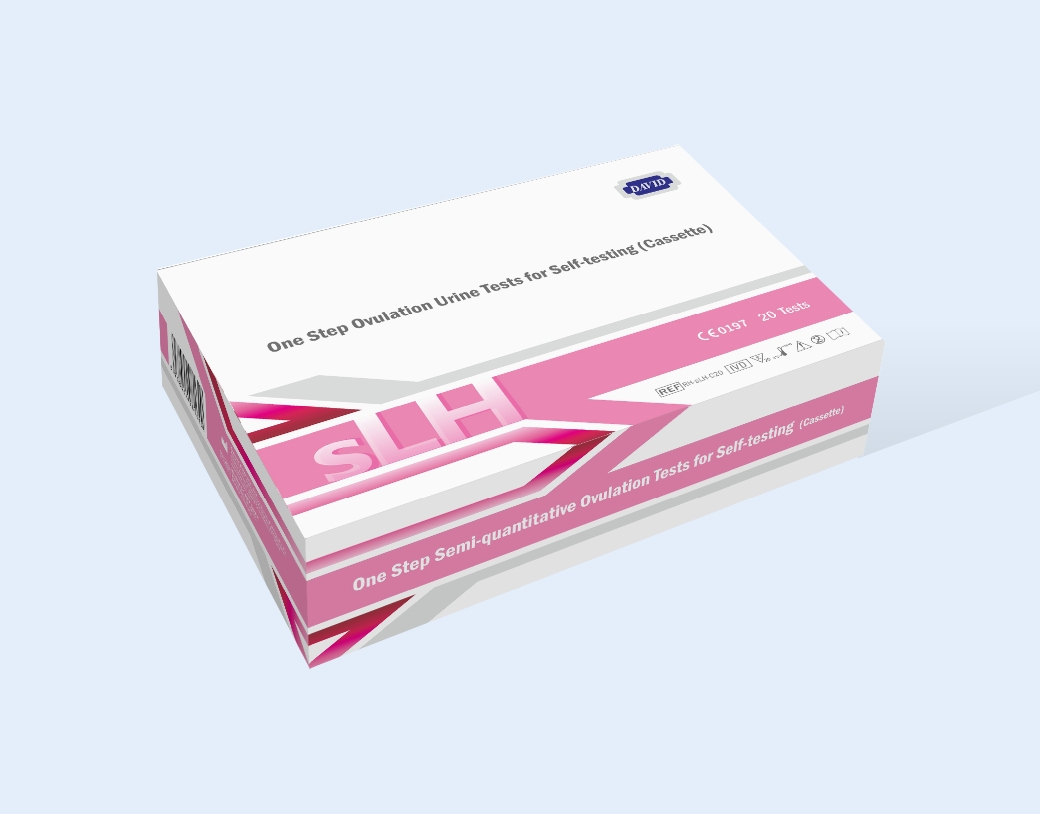
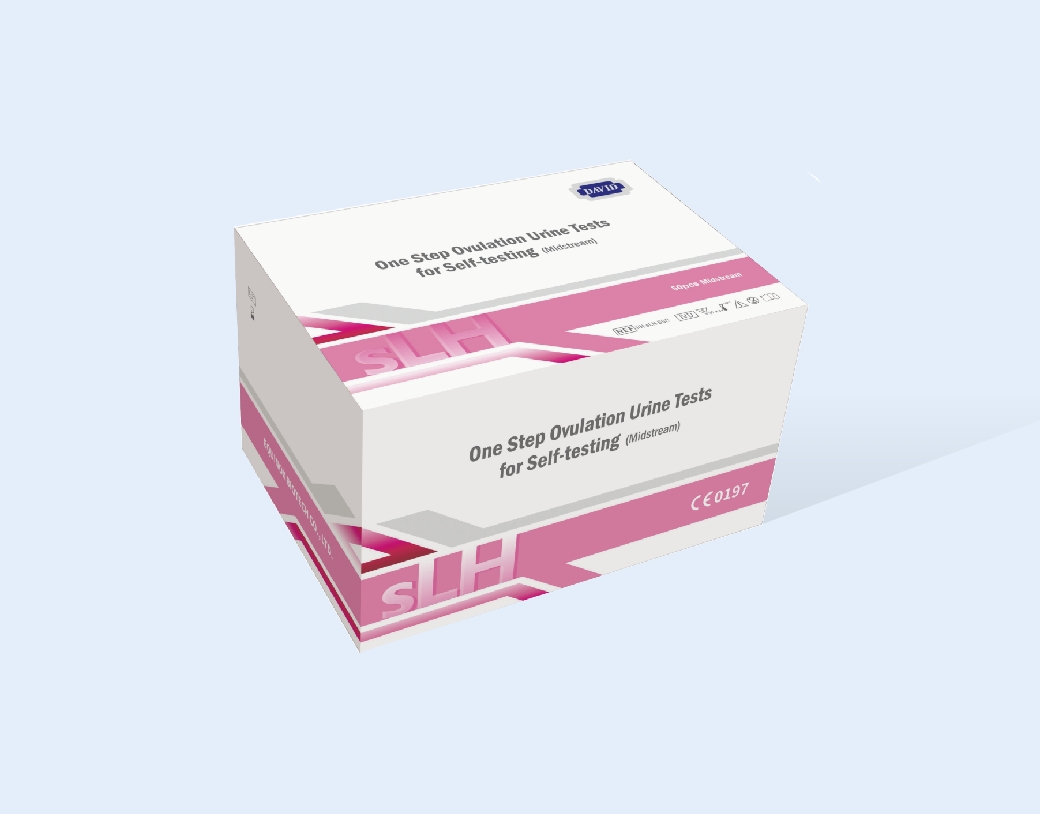
| Product Name | One Step Semi-Quantitative Ovulation Test |
| Model |  |
| Intended Use | This product is a semi-qualitative, one-step assay for detection of human luteinizing hormone (LH) in urine as an aid in conception by reliably predicting ovulation. |
| Test Method |
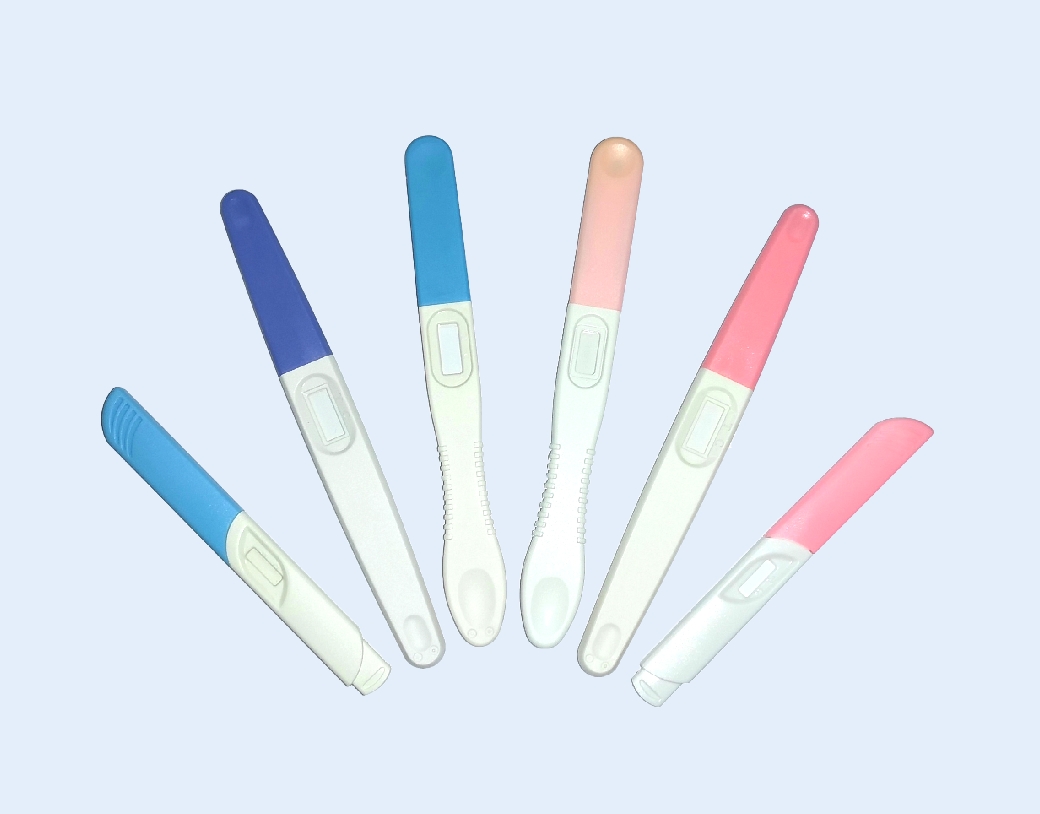
? Strip (1) Remove the device from the sealed pouch.? (2) With arrows pointing toward the urine sample, immerse the device vertically in the urine sample for at least 10 seconds.? (3) Start timing and observe the result within 5-10 minutes. ? Cassette? (1) Remove the device from the sealed pouch and lay it on a flat surface.? (2) Take out the dropper provided with the device, draw urine and then continuously add 2-3 drops into the sample well.? ?(3) Start timing and observe the result within 5-10 minutes. ? Midstream? (1) Remove the device from the sealed pouch.? (2) Hold the handle of the device, take off the cap (if any), then directly urinate towards the absorbent tip for 2-3s. After that put on the cap (if any) and lay the device on a flat surface or keep holding it flat. The alternative method is that hold the handle of the device, take off the cap (if any), immerse the device vertically in the urine sample for at least 10 seconds. Remove the device from urine sample and lay it on a flat surface or keep holding it. ? (3) Start timing and observe the result within 5-10 minutes.
|
|
Interpretation of Results |
1. Observe and Record the Test Result ? (a)Invalid: If no red line appears in the control line (C) area, the test result is invalid.? (b) Red line appears only in the control line (C) area but not in the test line (T) area. It means the concentration of LH in the test sample is 0. Record the test result accordingly.? 2.Drawing of LH fluctuation curve
Spot the corresponding positions on the detection chart, the horizontal axis is the number of detections and the vertical axis is the value of LH (detected results), according to the detected values every day, then connect the spots to get a LH curve. From curve you can clearly see the LH peak.
|


 ?
?